Column-wise Settings
Tables are composed of several columns with different data types. There are some settings that can be applied to each column individually, for better visualizing the data and safely editing the data.
Contents
Each column-specific setting is stored as a dict like field.
Colormap
A “colormap” is a function that maps a value to a color. All the colormaps are stored in
text_color / background_color fields.
Use Colormap Functions
The text color and the background color can be set for each column.
You can provide a custom colormap function to do this by set() method of fields.
A colormap function must return a RGBA array (0-255) or a standard color name.
viewer = TableViewer()
table = viewer.open_sample("iris")
lmin = table.data["sepal_length"].min()
lmax = table.data["sepal_length"].max()
lrange = lmax - lmin
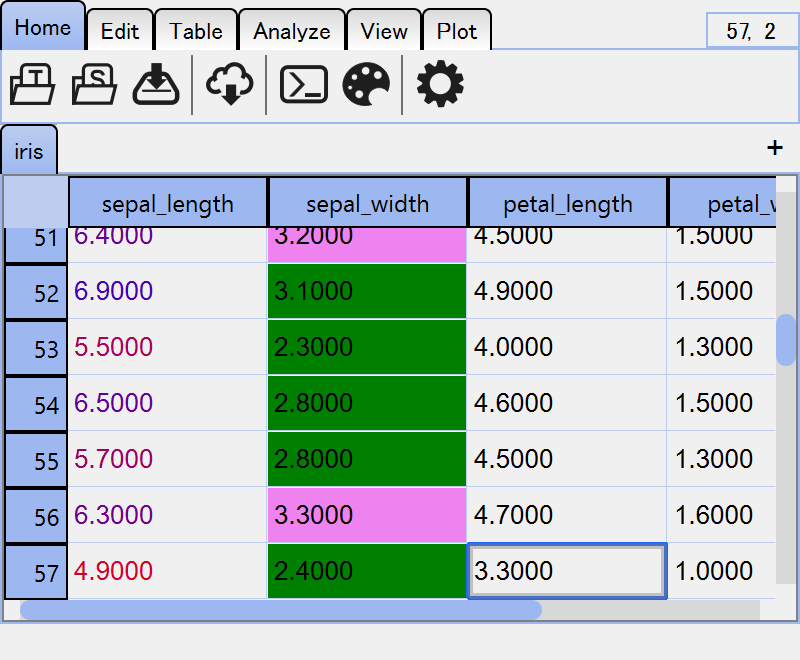
# set a continuous colormap to the "sepal_length" column
@table.text_color.set("sepal_length")
def _(x: float):
red = np.array([255, 0, 0, 255], dtype=np.uint8)
blue = np.array([0, 0, 255, 255], dtype=np.uint8)
return (x - lmin) / lrange * blue + (lmax - x) / lrange * red
# set a discrete colormap to the "sepal_width" column
@table.background_color.set("sepal_width")
def _(x: float):
    return "green" if x < 3.2 else "violet"
Since the fields are dict like, you can refer to existing colormaps or set new ones.
print(table.text_color["sepal_length"])  # get the colormap function
table.text_color["sepal_length"] = new_cmap  # set a new colormap
del table.text_color["sepal_length"]  # reset the existing colormap
Use Dictionaries
For categorical data, you can also use dictionaries to set the colors.
cmap = {
    "setosa": "red",
    "versicolor": "green",
    "virginica": "blue",
}
# set discrete colormap
table.text_color.set("species", cmap)
# or like this
table.text_color["species"] = cmap
Use matplotlib Colormaps
The colormap names defined in matplotlib are available. Limits of the contrast
will be defined by the mininum/maximum values of the column.
table.text_color["sepal_length"] = "inferno"
Note
Since colormaps are defined continuously, data type of the column must be numbers, datetime or timedelta.
Interpolate Colors to Define Colormaps
In many cases, you’ll want to define your own colormap by supplying colors that represent the minimum/maximum values, or several colors with their corresponding values.
The interp_from argument is useful for this purpose. A linearly segmented
colormap will be defined .
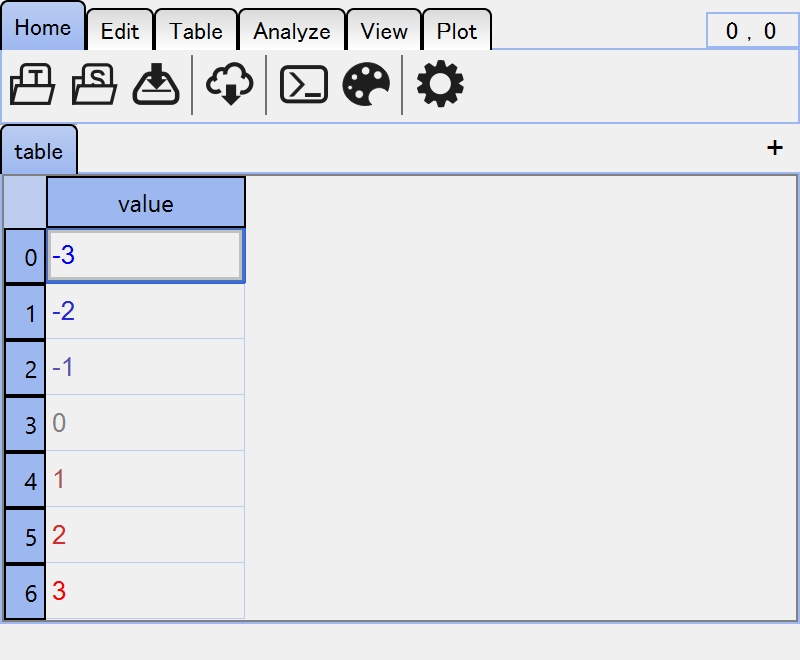
viewer = TableViewer()
table = viewer.add_table({"value": [-3, -2, -1, 0, 1, 2, 3]})

# use value -> color mapping
table.text_color.set("value", interp_from={-3: "blue", 0: "gray", 3: "red"})

# or a list of (value, color)
table.text_color.set("value", interp_from=[(-3, "blue"), (0, "gray"), (3, "red")])
Note
You can just pass a list of colors to define a equally divided colormap.
table.text_color.set("value", interp_from=["blue", "gray", "red"])
The simplest argument will be two colors, which represent minimum/maximum.
table.text_color.set("value", interp_from=["blue", "red"])
Set Colormaps in GUI
Some basic colormaps are available in the right-click context menu of the columns, such as .
Update Colormaps
There are several ways to update the existing colormap.
Update opacity
set_opacity()method takes a value between 0 and 1 to changes the alpha channel of the output color.table.text_color.set_opacity("A", 0.5)
Invert colormap
invert()method invert the returned RGB value of the colormap.table.text_color.invert("A")
Adjust brightness of colormap
adjust_brightness()takes a value between -1 and 1 to change the brightness of the current colormap.table.text_color.adjust_brightness("A", 0.5) # brighter table.text_color.adjust_brightness("A", -0.5) # darker
Validator
Simple data type conversion is sometimes not enough. To make editing data safer, you can customize the validator for each column.
Set validator Functions
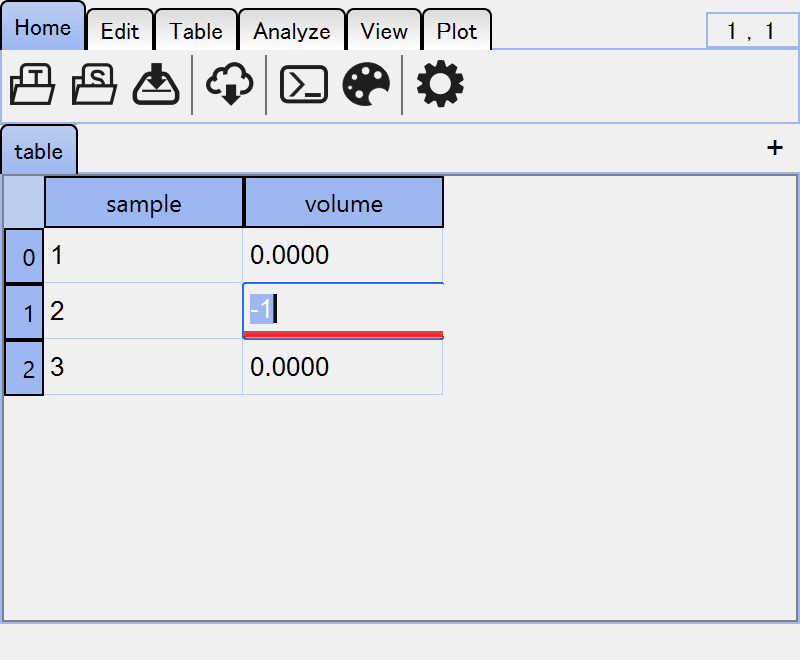
A validator function doesn’t care about the returned value. It should raise an exception if the input value is invalid. In following example, negative value is interpreted as invalid and the editor becomes red.
viewer = TableViewer()
table = viewer.add_table(
    {"sample": [1, 2, 3], "volume": [0., 0., 0.]},
    editable=True,
)

@table.validator.set("volume")
def _(x: float):
    if x < 0:
        raise ValueError("Volume must be positive.")
Note
A Table object converts the input value to the data type of the column.
The validator function is called after the conversion.
Note
Unlike other column setting, validators can NOT be set from GUI. This is because changing data validation rule might break the safety of the table data.
Text Formatter
Text formatters are used to convert the values to strings without changing the data itself. This is useful for displaying data in a more readable format.
Note
Text formatters are called every time cells are painted. Formatters should not take too much time to run.
Set formatter function
As usual in this chapter, you can use functions that convert a value into a string as formatter function.
The formatted strings do not affect the real data.
The formatted strings are not necessary to satisfy the column specific validation including data type conversion.
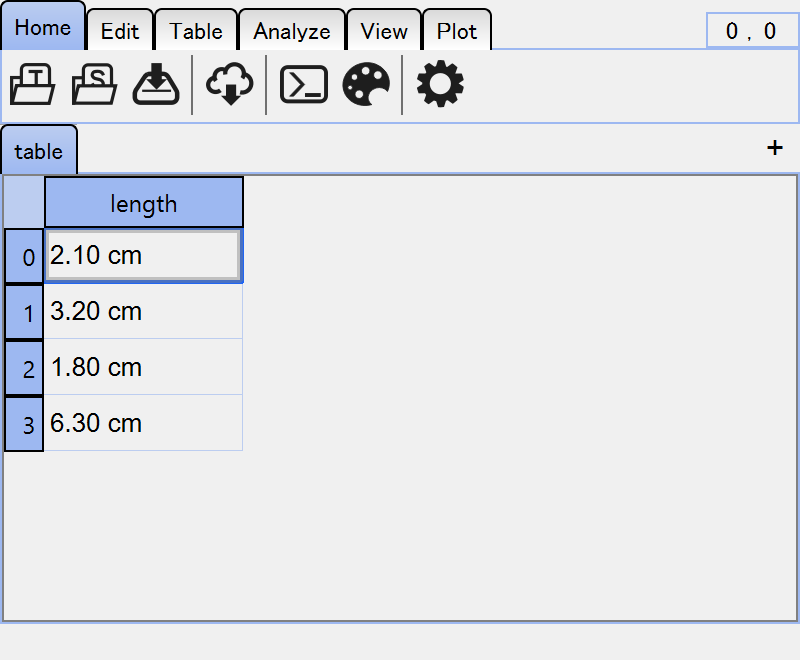
viewer = TableViewer()
table = viewer.add_table({"length": [2.1, 3.2, 1.8, 6.3]})

@table.formatter.set("length")
def _(x: float):
    return f"{x:.2f} cm"
Set formatter string
Instead of passing a function, you can also use a ready-to-be-formatted strings.
table.formatter.set("sepal_length", "{:.2f} cm")

# or use __setitem__
table.formatter["sepal_length"] = "{:.2f} cm"
Example above is identical to passing "{:.2f} cm".format.
Set Formatter in GUI
Some basic formatters are available in the right-click context menu of the columns, such as . You’ll see a preview of the column in the dialog.
Typing Spreadsheet
In a spreadsheet, data types are determined for each column based on its content
because a spreadsheet is a string-based table data in general. This characteristic
raises a problem of data type. This drawback is especially important when you want
to use data types such as datetime64 or category.
To solve this problem, SpreadSheet implements a typing system on each column.
You can tag any data types supported by pandas to each column, and optionally
set validator functions appropriate for the data types.
viewer = TableViewer()
sheet = viewer.add_spreadsheet({"int": [1, 2, 3], "label": ["a", "b", "c"]})

# set dtypes
sheet.dtypes["int"] = "int64"
sheet.dtypes["label"] = "category"

# since "dtypes" is a dict-like field, you can also use "update"
sheet.dtypes.update(int="int64", label="category")

# set dtypes and default validators
sheet.dtypes.set("int", "int64")
sheet.dtypes.set("label", "category")
sheet.data.dtypes
int    int64
label  category
dtype: object
You can also set dtypes from GUI. Right-click the column header and select .
Use Syntax of Table Subset
A pd.Series-like table subset, TableSeries can be obtained by
indexing a table.
sheet = viewer.open_sample("iris")
sheet["sepal_length"]
<TableSeries<'sepal_length'> of SpreadSheet<'sheet'>>
TableSeries also as fields such as text_color and formatter
and they can be considered as partial table fields.
print(sheet["sepal_length"].formatter)  # get formatter function
sheet["sepal_length"].formatter = f"{:2f} cm"  # set formatter
del sheet["sepal_length"].formatter  # reset formatter
Colormap can also be updated this way.
sheet["sepal_length"].background_color.set(interp_from=["violet", "teal"])
sheet["sepal_length"].background_color.set_opacity(0.5)