Integrate Custom Widgets
There are several places to integrate your custom widgets to tabulous viewer.
Dock Widget Area
Dock widget areas are located outside the central table stack area. Widgets docked in this area are always visible in the same place no matter which table is activated.
Add Qt Widgets
from qtpy.QtWidgets import QWidget

class MyWidget(QWidget):
    def __init__(self, parent=None):
        super().__init__(parent)
        self.setObjectName("MyWidget")

widget = MyWidget()
viewer.add_dock_widget(widget)
Use Magicgui Widget
Basic usage
from magicgui import magicgui

@magicgui
def f(tip: str):
    viewer.status = tip

viewer.add_dock_widget(f)
tabulous type annotations
Note
In napari`, you can use such as ImageData as an alias for np.ndarray type,
while inform @magicgui that the data you want is the array stored in an Image
layer, or returned array should be added as a new Image layer. tabulous uses
the same strategy to recover a pd.DataFrame from the table list or send a new one
to the viewer.
TableData type is an alias of pd.DataFrame. Arguments annotated by this
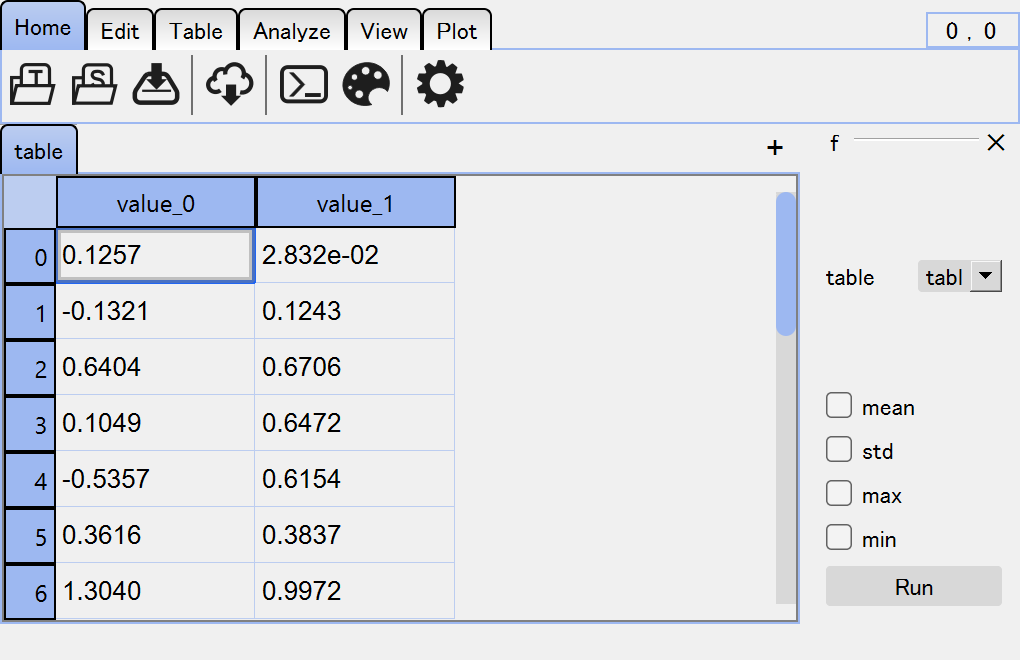
type will be interpreted as a combobox of table data by magicgui.
from tabulous.types import TableData

@magicgui
def f(table: TableData, mean: bool, std: bool, max: bool, min: bool) -> TableData:
    funcs = []
    for checked, f in [(mean, np.mean), (std, np.std), (max, np.max), (min, np.min)]:
        if checked:
            funcs.append(f)
    return table.apply(funcs)

viewer.add_dock_widget(f)

Table Side Area
Every table has a side area that can be used to add table-specific widgets or show table-specific information.
Custom Qt widgets or magicgui widgets can be added to the side area using
add_side_widget() method.
table = viewer.tables[0]
table.add_side_widget(widget)
# if you want to give a name to the widget
table.add_side_widget(widget, name="widget name")

# example
from magicgui import magicgui

@magicgui
def func():
    print(table.data.mean())

table.add_side_widget(func)
Built-in Widgets
There are built-in widgets that uses the table side area by default.
Undo stack widget
Undo/redo is implemented for each table. You can see the registered operations in a list view in the side area. You can open it by pressing Ctrl+H.
Plot canvas
Interactive
matplotlibcanvas is available in the “Plot” tool or thepltfield of table widgets.
Table Overlay Widget
Instead of the side area, you can also add widgets as an overlay over the table. An overlay widget is similar to the overlay charts in Excel.
table = viewer.tables[0]
table.add_overlay_widget(widget)
# if you want to give a label to the widget
table.add_overlay_widget(widget, label="my widget")
# you can give the top-left coordinate of the widget
table.add_overlay_widget(widget, topleft=(5, 5))