User Interface
Contents
Tables
Move and scroll
Arrow keys (→ ← ↑ ↓) with Ctrl (or ⌘ in Mac), Shift modifier work as you expects in most of table data editors.
Arrow keys (→ ← ↑ ↓) with Ctrl + Alt scrolls the table to the desired direction. You can also scroll tables using the scroll bar, or right-dragging.
Zoom
Ctrl +
mouse wheelzooms in/out the table.You can also use keybindings Ctrl Shift > Ctrl Shift < to zoom in/out.
Resize
Cells and headers can be resized by dragging the borders of header sections.
Edit cells and headers
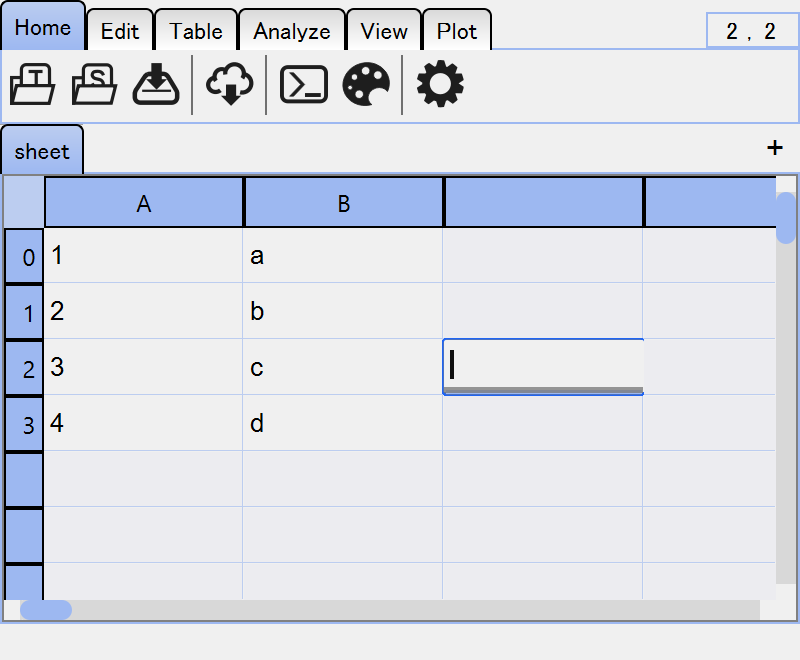
If a table is editable, you can edit the values of cells and headers. Double-clicking, F2 or typing any characters will create an editor for the value.
During editing, the text will always be validated. Invalid text will be shown in red. For the table cells, you can set any validation rules (see Column-wise Settings). For the table headers, duplicated names are not allowed and considered to be invalid.
Excel-style data evaluation
Simple analysis should be done inside the table cells, especially when you are using
SpreadSheet. In Excel and Google Spreadsheet, you can do it by typing, say, =SUM(A1:A4),
to calculate the sum of the values in the range A1:A4.
In tabulous, string starts with = will be evaluated as a Python literal. Current table
data is available as a variable df. By default, modules numpy and pandas are
also available as np and pd. If the input string starts with =, the editor is
automatically switched to the literal evaluation mode and cell selection will insert table data
reference to the editor. For instance, if you select column 'A' and rows from 1 to 8, then
df[1:9, 0:1] will be inserted.
One of the differences between this mode and Excel is that this evaluation does not use reference, so that changing the value of any of the source cells will NOT affect the value of the destinations.
Note
If you want to edit a cell to a string starts with “=”, such as “=a”, then you can type
="=a".
Scalar value
If the evaluation result is a scalar value,
col-0 |
col-1 |
|
|---|---|---|
0 |
10 |
=np.sum(df[‘col-0’][0:3]) |
1 |
20 |
|
2 |
30 |
it will simply update the current cell.
col-0 |
col-1 |
|
|---|---|---|
0 |
10 |
60 |
1 |
20 |
|
2 |
30 |
Column vector
If the evaluation result is an array such as pd.Series,
col-0 |
col-1 |
|
|---|---|---|
0 |
10 |
=np.cumsum(df[‘col-0’][0:3]) |
1 |
20 |
|
2 |
30 |
it will update the relevant cells.
col-0 |
col-1 |
|
|---|---|---|
0 |
10 |
10 |
1 |
20 |
30 |
2 |
30 |
60 |
You don’t have to edit the top cell. As long as the editing cell will be one of the destinations, result will be the same.
col-0 |
col-1 |
|
|---|---|---|
0 |
10 |
|
1 |
20 |
=np.cumsum(df[‘col-0’][0:3]) |
2 |
30 |
Row vector
An row will be updated if the result should be interpreted as a row vector.
col-0 |
col-1 |
|
|---|---|---|
0 |
10 |
20 |
1 |
20 |
40 |
2 |
30 |
60 |
3 |
=np.mean(df.loc[0:3, ‘col-0’:’col-1’]) |
will return pd.Series([20, 40]), which will update the table to
col-0 |
col-1 |
|
|---|---|---|
0 |
10 |
20 |
1 |
20 |
40 |
2 |
30 |
60 |
3 |
20 |
40 |
Evaluate with references
To use cell references like Excel, use “&=” instead of “=”.
col-0 |
col-1 |
|
|---|---|---|
0 |
10 |
&=np.mean(df[‘col-0’][0:3]) |
1 |
20 |
|
2 |
30 |
col-0 |
col-1 |
|
|---|---|---|
0 |
10 |
20 |
1 |
20 |
|
2 |
30 |
When one of the cell is edited, the value of the destination will also be updated. For instance,
editing 10 → 40 will cause the value of (0, "col-1") to be updated to 30.
User-defined namespace
As stated above, the default namespace of cell evaluation is df, np and pd. If you
want to add more variables or functions, there are two ways to do it.
Update the
Namespaceobject of a viewer.viewer = TableViewer() viewer.namespace # the Namespace object is a dict-like object def func(df): # the function you want to add return df.mean() viewer.namespace["func"] = func # add the function to the namespace # the easiest way to add a function or a class @viewer.namespace.add def func(df): return df.mean()
Modify the startup file.
The startup file is a Python script that will be executed whenever a viewer is created. The default startup file is
{$profile}/cell_namespace.py, where{$profile}is the user directory fortabulous(you can check it by$ tabulous --profile). All the variables that are not start with_will be added to the namespace. You can also restrict the variables to be added by setting__all__.# {$profile}/cell_namespace.py from scipy import stats __all__ = ["func", "stats"] def func(df): return df.mean()
Note
You can’t use none of
np,pdordfas a variable name.
Add cell labels
People using spreadsheets usually want to name some of the cells. For instance, when you calculated the mean of a column, you want to name the cell as “mean”. Usually, it is done by editing one of the adjacent cells.
A |
B |
|---|---|
1 |
mean |
2 |
2.5 |
3 |
|
4 |
In tabulous, however, you can directly name the cell using cell label. You can edit
cell labels by F3 key.
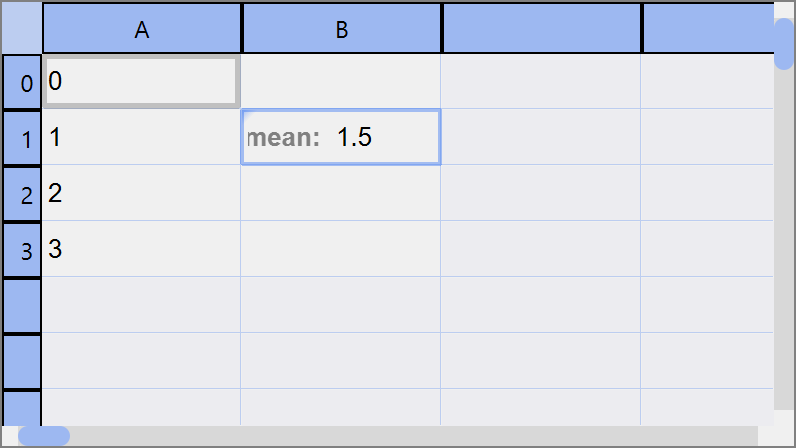
Table Tabs
All the tables are managed by the table tabs.
You can double-click to rename the tab. The
nameproperty of the table will also be updated.You can run table specific actions by right-clicking the tab.
You can drag-and-drop tabs between viewers by right-drag.
Toolbar
Toolbar contains many functions that help you with analyzing the table data.
Note
You can “click” any buttons in the toolbar using the keyboard; push Alt (or ⌥ in Mac) to change focus to the toolbar, and follow the tooltip labels to find the appropriate key combo to get to the button you want (similar to Microsoft Office).
Home menu
 … Open a table data as a
 Tablefrom a file using a file dialog. … Open a table data as a
 SpreadSheetfrom a file using a file dialog. … Save the currently active table data using a file dialog.
 … Open a sample data from
 seaborn. … Toggle the console widget visibility.
 … Open the command palette.
Edit menu
 … Copy the selected cells to the clipboard.
 … Paste the clipboard data to the selected cells.
 … Cut the selected cells to the clipboard.
 … Undo the last table action.
 … Redo the last table action.
Table menu
 … Make a copy of the active table as a
 Table. … Make a copy of the active table as a
 SpreadSheet. … Call
 pd.groupby()on the active table. … Switch the column header and the first row.
 … Call
 pd.pivot()on the active table. … Call
 pd.melt()on the active table.
Analyze menu
 … Summarize table data by mean, standard deviation etc.
 … Evaluate a string expression on the table data. Essentially equivalent
to call
… Evaluate a string expression on the table data. Essentially equivalent
to call pd.eval(). … Open the finder widget. Several item matching mode (match by text,
match by value, partial match and regular expression) are available.
… Open the finder widget. Several item matching mode (match by text,
match by value, partial match and regular expression) are available. … Sort table by a column.
 … Filter table data by a string expression.
 … Minimize a loss using
 scipy.optimize. … Perform statistical tests on the table data using
 scipy.stats. … Perform clustering, regression or decomposition on the table data using
 scikit-learn.
View menu
 … Popup current active table.
 … Activate dual view mode (horizontal).
 … Activate dual view mode (vertical).
 … Reset view mode.
 … Tile tabs.
 … Untile tabs.
 … Switch the layout of the side area.
Plot menu
 … Plot table data by
 plt.plot(). … Plot table data by
 plt.scatter(). … Plot histogram of the data by
 plt.hist(). … Create a new figure on the side area.
The embedded plot canvas is interactive. You can also double click the objects in plot canvas to edit its color, line width, etc.
Warning
The matplotlib editor is WIP now. Its behavior may change in the future.