Basics
In whitecanvas, a "canvas" is an object with a layer list, axes elements, labels and
methods to handle them. A "grid" is a collection of canvases and is implemented with
rendering backends.
Create Canvases
Canvas is created by new_canvas method.
backend: the name of the backend to use.size: the size of the canvas (width × height in pixels).palette: the name of the color palette to use. Any input that is accepted by the cmap.Colormap can be used, which includes:- The name of the built-in colormaps, such as "viridis", "plasma", etc.
- Sequence of colors, such as
["red", "green", "blue"]. - A
cmap.Colormapobject.
from whitecanvas import new_canvas

canvas = new_canvas("matplotlib", size=(400, 300), palette="tab10")
A SingleCanvas object is returned. It can be considered as a mixture of a canvas
and a grid. All of the functions mentioned above are implemented in this object.
Therefore, you can show the canvas by calling the show method.
canvas.show() # show the canvas, depending on the backend
Namespaces
To make the API tidy, each element of a canvas is organized in namespaces. By using
namespaces, we can avoid the long list of arguments and make the code more readable.
For example, the x-limit of the canvas is controlled by the property canvas.x.lim.
Following list shows the namespaces and the properties associated with them.
-
canvas.{x, y}: the x/y-axis.- (property)
canvas.{x, y}.lim: the x/y-limit as a tuple of floats. - (property)
canvas.{x, y}.color: the color of the x/y-axis. - (property)
canvas.{x, y}.flipped: whether the x/y-axis is flipped. canvas.{x, y}.label: the x/y-axis label.- (property)
canvas.{x, y}.label.text: the text of the label. - (property)
canvas.{x, y}.label.color: the color of the label asndarray. - (property)
canvas.{x, y}.label.size: the font size of the label. - (property)
canvas.{x, y}.label.family: the font family of the label. - (property)
canvas.{x, y}.label.visible: the visibility of the label.
- (property)
canvas.{x, y}.ticks: the x/y-axis ticks.- (property)
canvas.{x, y}.ticks.pos: the position of the ticks (read-only). - (property)
canvas.{x, y}.ticks.labels: the labels of the ticks (read-only). - (property)
canvas.{x, y}.ticks.color: the color of the ticks. - (property)
canvas.{x, y}.ticks.size: the size of the ticks. - (property)
canvas.{x, y}.ticks.rotation: the color of the tick labels. - (property)
canvas.{x, y}.ticks.visible: the visibility of the ticks.
- (property)
- (property)
-
canvas.title: the title object of the canvas.- (property)
canvas.title.text: the text of the title. - (property)
canvas.title.color: the color of the title asndarray. - (property)
canvas.title.size: the font size of the title. - (property)
canvas.title.family: the font family of the title. - (property)
canvas.title.visible: the visibility of the title.
- (property)
Note
canvas.title, canvas.{x, y}.label and canvas.{x, y}.ticks share the same
properties (color, size, family and visible) related to the text design.
Event handlers are also organized in namespaces. At any level, the value-changed event
for the parameter X is in events.X. For example, when the x-limit is changed, signal
will be emitted from canvas.x.events.lim. See Event Handling for
more details.
Update Canvas Appearance
Canvases have helper functions of name update_* to update the appearance. They return
the canvas itself, so that you can chain the methods after the constructor.
# update the color of x/y-axis
canvas = new_canvas().update_axes(color="gray")

# update the text labels
canvas = new_canvas().update_labels(x="time", y="value", title="My Plot")
Add Layers
All the plotting elements are added to the canvas as a "layer". In whitecanvas, a
layer is rarely constructed directly, but is returned by the add_* methods. Same
method always returns the same type of layer.
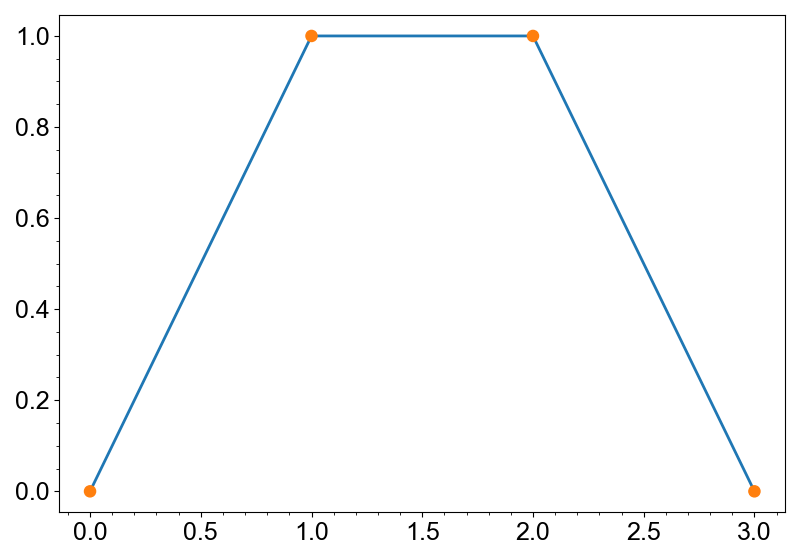
from whitecanvas import new_canvas

canvas = new_canvas("matplotlib")
line = canvas.add_line([0, 1, 2, 3], [0, 1, 1, 0])
markers = canvas.add_markers([0, 1, 2, 3], [0, 1, 1, 0])
canvas.show()
See Layers for more details.