Layer Groups
To plot complex layers, whitecanvas uses the layer-grouping strategy. There are
several built-in layer groups.
Plot=Line+MarkersLineBand=Line+BandLabeledLine=Line+Errorbar×2 +TextsLabeledMarkers=Markers+Errorbar×2 +TextsLabeledBars=Bars+Errorbar×2 +TextsLabeledPlot=Plot+Errorbar×2 +TextsStem=Markers+MultiLineGraph=Markers+MultiLine+Texts
These layer groups can be derived from primitive layers. It's very important to note that this layer-grouping architecture makes complex plots to have consistent argument with the individual plot elements.
Layer Groups with Lines
In this section, we will introduce layer groups that are derived from the Line layer.
Add markers and/or error bars
from whitecanvas import new_canvas

canvas = new_canvas("matplotlib")

layer = canvas.add_line(
    [0, 1, 2], [3, 2, 4], color="black", name="myplot",
).with_markers(
    symbol="o", color="red"
)
canvas.show()

The with_markers method returns a Plot layer, which has Line and Markers as its
children. Therefore, at the very least, any customization can be done on the children.
print(layer)  # Plot<'myplot'>
print(layer.line)  # Line<'line-of-myplot'>
print(layer.markers)  # Markers<'markers-of-myplot'>
Once the layer is grouped, layer group instead of the child layers are in the layer list.
print(canvas.layers) # LayerList([Plot<'myplot'>])
The Plot layer can be further converted into a LabeledPlot layer by adding error
bars using with_xerr and/or with_yerr method.
from whitecanvas import new_canvas

canvas = new_canvas("matplotlib")

(
    canvas
    .add_line([0, 1, 2], [3, 2, 4], color="black")
    .with_markers(symbol="o", color="red")
    .with_yerr([0.1, 0.2, 0.3])
    .with_xerr([0.2, 0.3, 0.2], style="--")
)
canvas.show()

Add bands
Band may be used for different purposes.
- To fill the area of confidence interval.
- To fill the area between the line and the x- or y-axis.
Both cases can be achieved using the Line methods.
To fill the area that represents the errors, such as confidence interval and standard
deviation, use the with_xband or with_yband method.
from whitecanvas import new_canvas

canvas = new_canvas("matplotlib")

# one array for the same size of lower and upper bounds
(
    canvas
    .add_line([0, 1, 2], [3, 2, 4], color="blue")
    .with_yband([0.2, 0.3, 0.4])
)
# two arrays for different sizes of lower and upper bounds
(
    canvas
    .add_line([2, 3, 4], [1, 0, 2], color="red")
    .with_yband([0.2, 0.3, 0.4], [0.4, 0.6, 0.8])
)

canvas.show()

To fill the area between the line and the axis, use the with_xfill or with_yfill
respectively.
from whitecanvas import new_canvas

canvas = new_canvas("matplotlib")

(
    canvas
    .add_line([1, 2, 3], [2.4, 3, 4], color="blue")
    .with_xfill()
)
(
    canvas
    .add_line([2, 3, 4], [2, 1, 2], color="red")
    .with_yfill()
)

canvas.show()

Warning
with_xfill fill the area between the line and the y-axis. This is because the
orientation of the filling is in the direction of the y-axis, consistent with the
methods such as with_xband and with_xerr.
Add texts
Adding text at the data points can be done using the with_text method.
from whitecanvas import new_canvas

canvas = new_canvas("matplotlib")

(
    canvas
    .add_line([0, 1, 2], [3, 2, 4], color="black")
    .with_text(["i=0", "i=1", "i=2"], size=20, color="red")
)
canvas.show()

You can use text alignment and text offset to adjust the position of the text.
from whitecanvas import new_canvas

canvas = new_canvas("matplotlib")

(
    canvas
    .add_line([0, 1, 2], [3, 2, 4], color="black")
    .with_text(["i=0", "i=1", "i=2"], size=20, color="red")
    .with_text_offset(0.2, 0.0)
)
(
    canvas
    .add_line([3, 4, 5], [3, 2, 4], color="black")
    .with_text(["i=0", "i=1", "i=2"], size=20, color="green", anchor="top")
)
canvas.show()

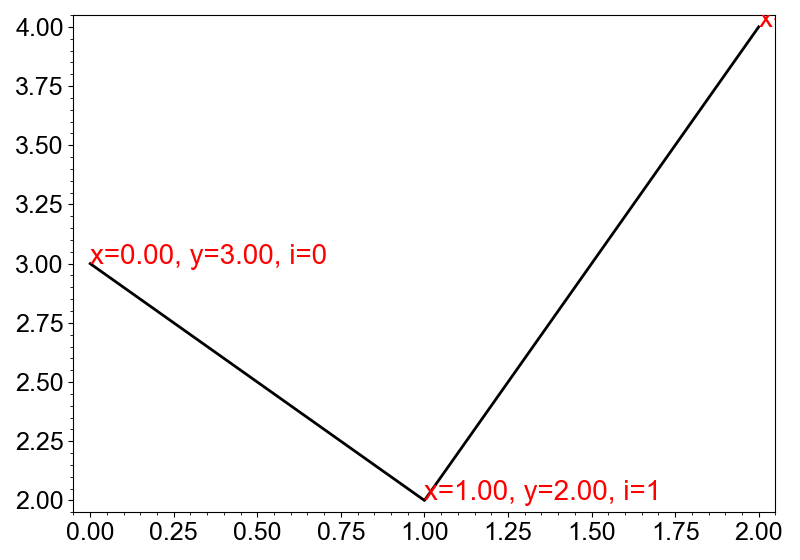
You can use "x", "y" and "i" as the placeholders in the text to format the text using the x/y data and the indices.
from whitecanvas import new_canvas

canvas = new_canvas("matplotlib")

(
    canvas
    .add_line([0, 1, 2], [3, 2, 4], color="black")
    .with_text("x={x:.2f}, y={y:.2f}, i={i}", size=20, color="red")
)
Layer Groups with Markers
Markers with error bars
Similar to the Line layer, the Markers layer can
also be grouped with the Errorbar layer.
from whitecanvas import new_canvas

canvas = new_canvas("matplotlib")

(
    canvas
    .add_markers([0, 1, 2], [3, 2, 4], color="black", symbol="D", size=10)
    .with_xerr([0.2, 0.3, 0.4], style="--")
    .with_yerr([0.3, 0.3, 0.5], style=":")
)
canvas.show()

Markers as stems
The Stem layer is a layer group of Markers and MultiLine. It can be created using
the with_stem method.
import numpy as np
from whitecanvas import new_canvas

canvas = new_canvas("matplotlib")

x = np.linspace(0, 4 * np.pi, 50)
(
    canvas
    .add_markers(x, np.sin(x))
    .with_stem()
)
canvas.show()

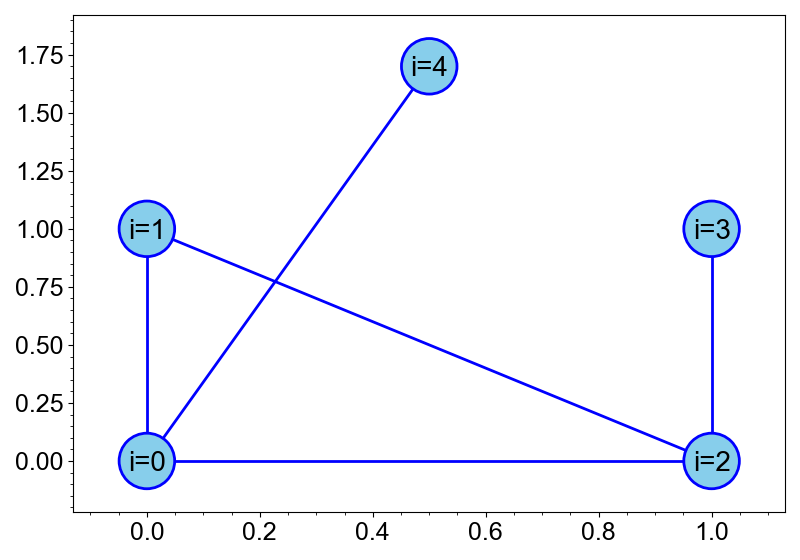
Markers as a graph network
A network graph is a collection of nodes and edges. The Graph layer is a layer group
that can created using the with_network method of Markers. It uses the list of
index pairs to connect markers.
from whitecanvas import new_canvas

canvas = new_canvas("matplotlib")

nodes = [[0.0, 0.0], [0.0, 1.0], [1.0, 0.0], [1.0, 1.0], [0.5, 1.7]]
connections = [[0, 1], [0, 2], [1, 2], [0, 4], [2, 3]]

(
    canvas
    .add_markers(nodes, size=40, color="skyblue")
    .with_edge(width=2, color="blue")
    .with_network(connections)
    .with_text(["i=0", "i=1", "i=2", "i=3", "i=4"], size=20)
)
canvas.show()