Categorical × Categorical Data
Here is an example of a data frame with two categorical columns.
import numpy as np

# sample data
rng = np.random.default_rng(12345)

df = {
    "x": ["A"] * 60 + ["B"] * 30 + ["C"] * 40,
    "y": ["X"] * 70 + ["Y"] * 60,
    "value": rng.normal(size=130),
}
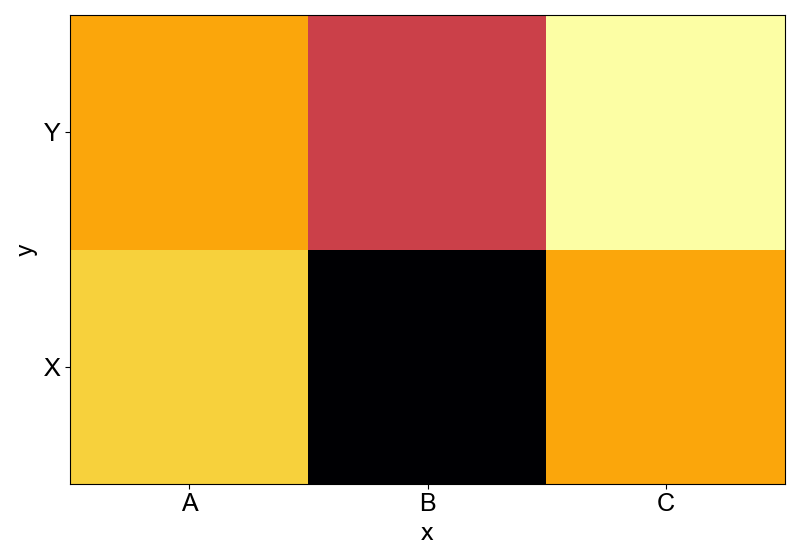
To use categorical columns for both x- and y-axis, aggregation is required. The most basic way to visualize the data is to use a heatmap.
from whitecanvas import new_canvas

canvas = new_canvas("matplotlib")
canvas.cat_xy(df, x="x", y="y").mean().add_heatmap("value")
You can also visualize the data using marker sizes.
from whitecanvas import new_canvas

canvas = new_canvas("matplotlib")
canvas.cat_xy(df, x="x", y="y").mean().add_markers("value")
