Legend for the Layers
Legend is an important component for data visualization. In whitecanvas, you can
automatically or manually create legends independent of the backend you are using.
Note
The legend is not supported in the vispy backend.
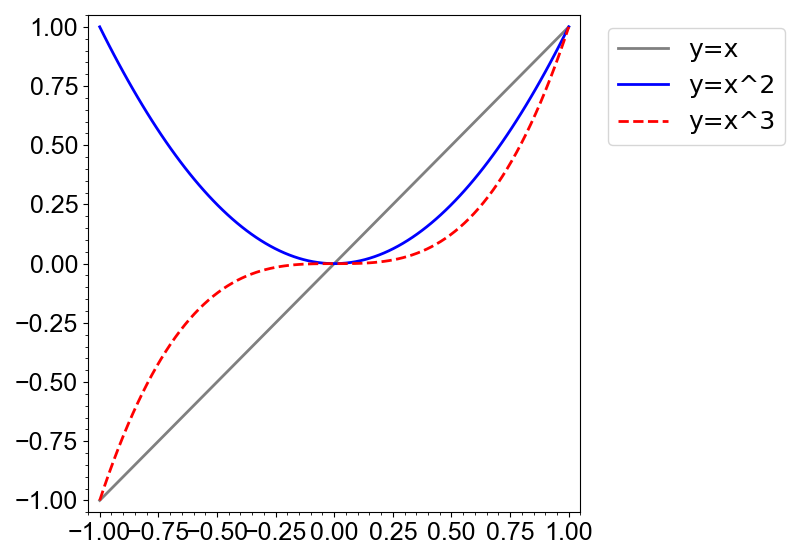
To create a legend, you can use the add_legend method. The layer names are used as
the labels of the legend.
import numpy as np
from whitecanvas import new_canvas

x = np.linspace(-1, 1, 100)
canvas = new_canvas(backend="matplotlib")
canvas.add_line(x, x, name="y=x", color="gray")
canvas.add_line(x, x**2, name="y=x^2", color="blue")
canvas.add_line(x, x**3, name="y=x^3", color="red", style="--")

canvas.add_legend()
canvas.show()
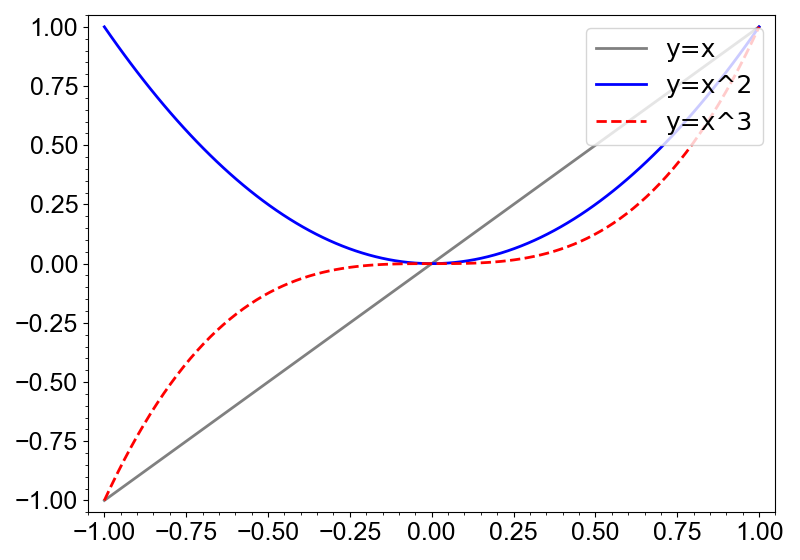
You can explicitly specify the layers to be included in the legend. If a str is given,
it is interpreted as the title.
import numpy as np
from whitecanvas import new_canvas

x = np.linspace(-1, 1, 100)
canvas = new_canvas(backend="matplotlib")
x1 = canvas.add_line(x, x, name="y=x", color="gray")
x2 = canvas.add_line(x, x**2, name="y=x^2", color="blue")
x3 = canvas.add_line(x, x**3, name="y=x^3", color="red", style="--")

canvas.add_legend(["odd functions", x1, x3])
canvas.show()

Legend location can be specified by the location argument.
import numpy as np
from whitecanvas import new_canvas

x = np.linspace(-1, 1, 100)
canvas = new_canvas(backend="matplotlib")
x1 = canvas.add_line(x, x, name="y=x", color="gray")
x2 = canvas.add_line(x, x**2, name="y=x^2", color="blue")
x3 = canvas.add_line(x, x**3, name="y=x^3", color="red", style="--")

canvas.add_legend(location="right_side_top")
canvas.show()