Namespaces
Each canvas has several namespaces to control the appearance of the canvas. First of
all, the x/y-axis properties are controlled by the x and y namespaces.
from whitecanvas import new_canvas

canvas = new_canvas(backend="matplotlib")

canvas.x.lim = (0, 10)
canvas.x.color = "red"
canvas.x.flipped = True
canvas.x.set_gridlines(color="gray", width=1, style=":")
canvas.show()

Labels
You can set x/y labels using the label property.
from whitecanvas import new_canvas

canvas = new_canvas("matplotlib")

canvas.x.label = "X axis"
canvas.y.label = "Y axis"
canvas.show()

The label property is actually another namespace. You can specify the text, font size,
etc. separately.
canvas = new_canvas("matplotlib")

canvas.x.label.text = "X axis"
canvas.x.label.size = 20
canvas.x.label.family = "Arial"
canvas.x.label.color = "red"
canvas.show()

Ticks
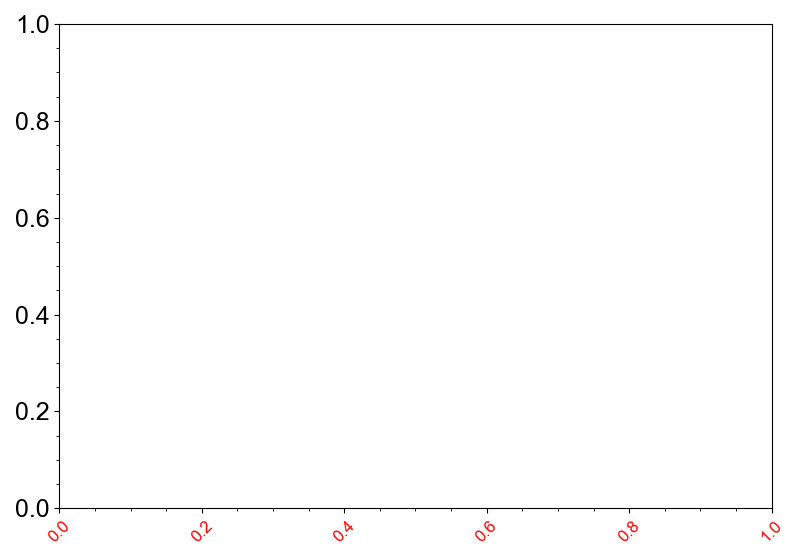
The tick properties can be set via ticks property.
from whitecanvas import new_canvas

canvas = new_canvas("matplotlib")

canvas.x.ticks.color = "red"
canvas.x.ticks.size = 12
canvas.x.ticks.family = "Arial"
canvas.x.ticks.rotation = 45
canvas.show()

You can also override or reset the tick labels.
from whitecanvas import new_canvas

canvas = new_canvas("matplotlib")

canvas.x.ticks.set_labels([0, 1, 2], ["zero", "one", "two"])
canvas.x.ticks.reset_labels()
canvas.show()

Title
Canvas title can be set via the title namespace.
from whitecanvas import new_canvas

canvas = new_canvas("matplotlib")

canvas.title.color = "teal"
canvas.title.size = 16
canvas.title.family = "Times New Roman"
canvas.show()
