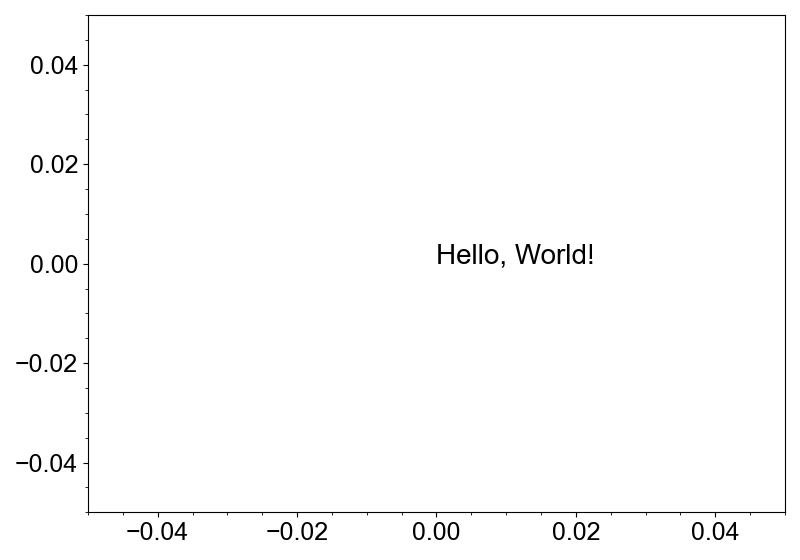
Texts
Text layer is a collection of text elements. It is usually created by the add_text method.
A text can be added by specifying the x and y coordinates, and the text string.
from whitecanvas import new_canvas

canvas = new_canvas("matplotlib")
canvas.add_text(0, 0, "Hello, World!", size=20, color="black")
canvas.show()
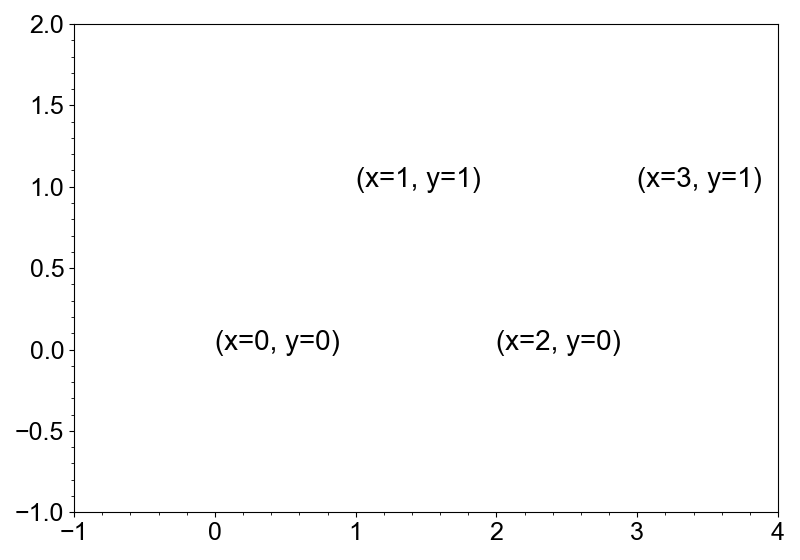
Multiple texts can be added by specifying the array of x and y coordinates, and the text strings.
from whitecanvas import new_canvas

canvas = new_canvas("matplotlib")
x = [0, 1, 2, 3]
y = [0, 1, 0, 1]
texts = [f"(x={x[i]}, y={y[i]})" for i in range(4)]
canvas.add_text(x, y, texts, size=20, color="black")
canvas.x.lim = (-1, 4)
canvas.y.lim = (-1, 2)
canvas.show()
The anchor= argument can be used to specify the text anchor position.
from whitecanvas import new_row

grid = new_row(2, backend="matplotlib").fill()

grid[0].add_markers([0], [0])
for anchor in ["top", "bottom", "left", "right"]:
    grid[0].add_text(0, 0, anchor, size=20, color="black", anchor=anchor)

grid[1].add_markers([0], [0])
for anchor in ["top_left", "top_right", "bottom_left", "bottom_right"]:
    grid[1].add_text(0, 0, anchor, size=20, color="black", anchor=anchor)

grid.show()

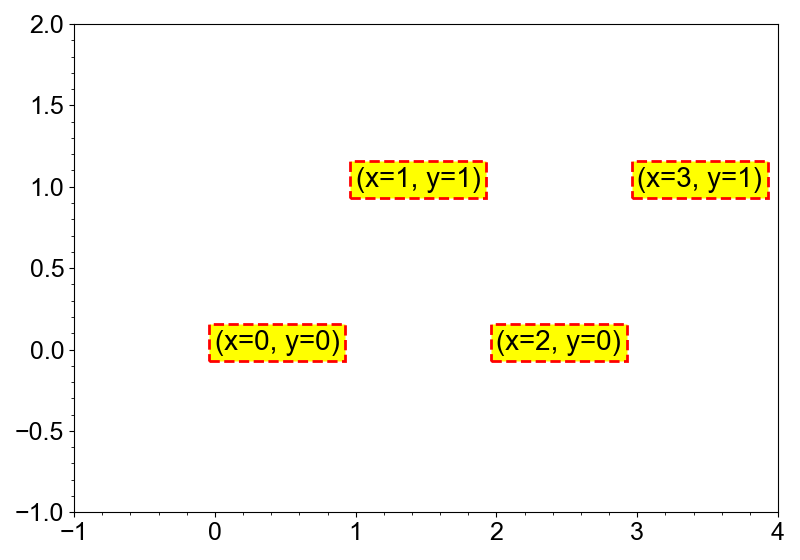
matplotlib, pyqtgraph and bokeh backends support background rectangles for the
texts. As for the layers with both faces and edges, with_face and with_edge methods
can be used to set the background face and edge properties.
from whitecanvas import new_canvas

canvas = new_canvas("matplotlib")
(
    canvas.add_text(x, y, texts, size=20, color="black")
    .with_face(color="yellow")
    .with_edge(color="red", width=2, style="--")
)
canvas.x.lim = (-1, 4)
canvas.y.lim = (-1, 2)
canvas.show()