Visualizing Distributions
There are several conventional ways to visualize distributions.
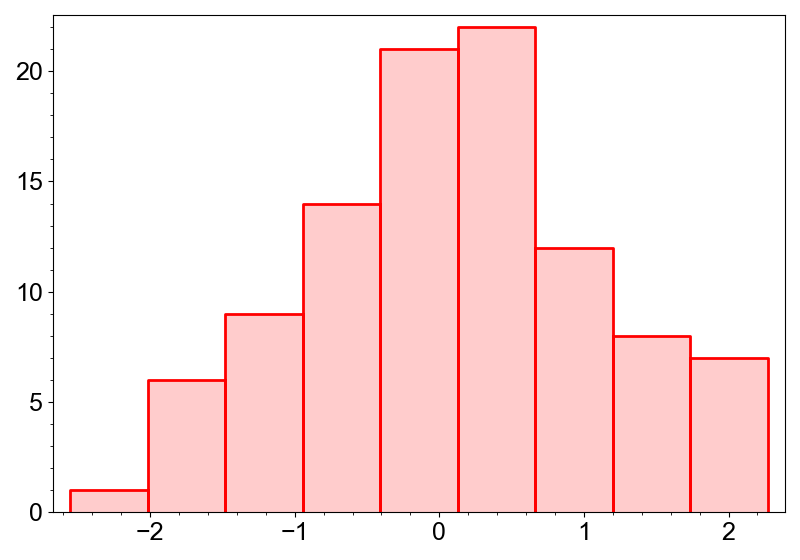
Histogram
Histogram is a layer that represents a histogram. It can be created by the
add_hist method.
import numpy as np
from whitecanvas import new_canvas

np.random.seed(0)
data = np.random.normal(size=100)  # sample data

canvas = new_canvas("matplotlib")
canvas.add_hist(data, color="red")
canvas.show()
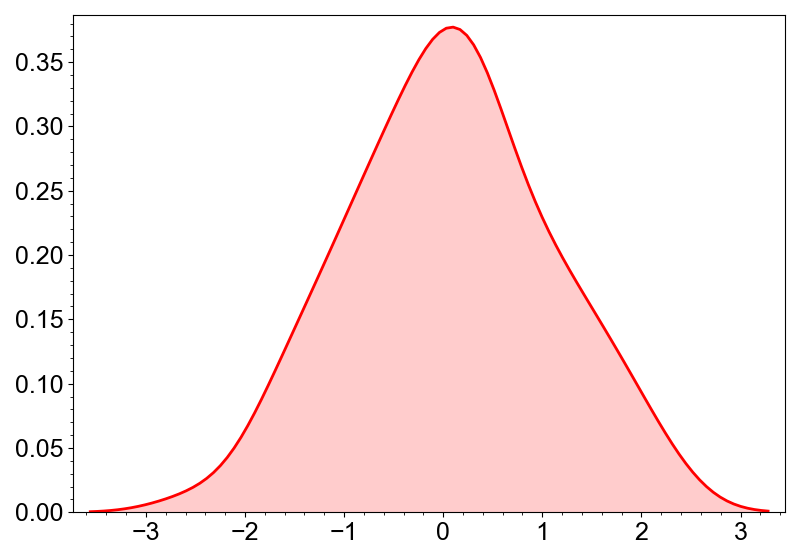
KDE
Kde is a layer that represents a kernel density estimation. It can be created by the
add_kde method.
import numpy as np
from whitecanvas import new_canvas

np.random.seed(0)
data = np.random.normal(size=100)  # sample data

canvas = new_canvas("matplotlib")
canvas.add_kde(data, color="red")
canvas.show()
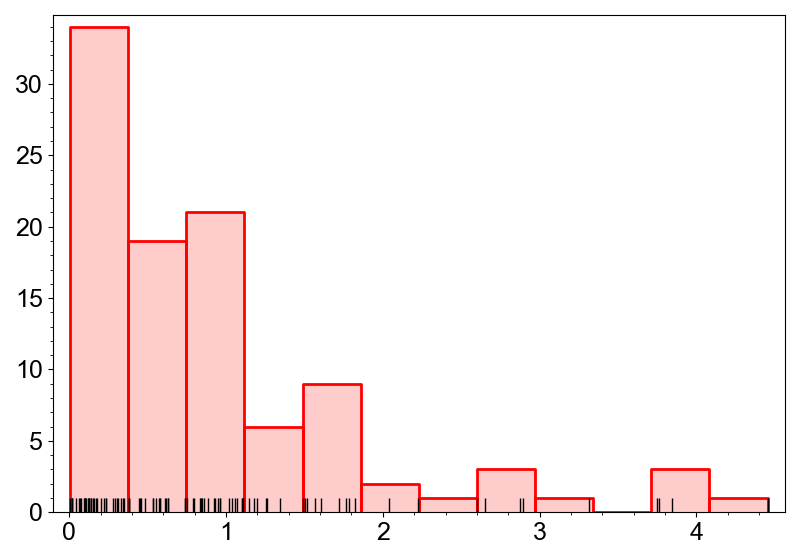
Rug
Rug is a layer that represents rug plot (or event plot). It can be created by the
add_rug method. Rug plots tend to overlap
with each other, so it is better at visualizing the individual data points rather than
the distribution. Therefore, it is usually useful to overlay the rug plot on the
histogram or the KDE.
import numpy as np
from whitecanvas import new_canvas

np.random.seed(0)
data = np.random.exponential(size=100)  # sample data

canvas = new_canvas("matplotlib")
canvas.add_hist(data, color="red")
canvas.add_rug(data)
canvas.show()
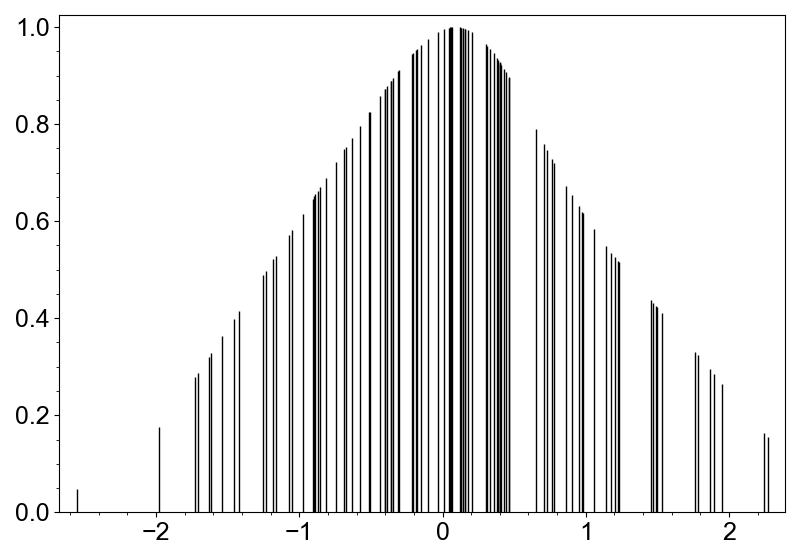
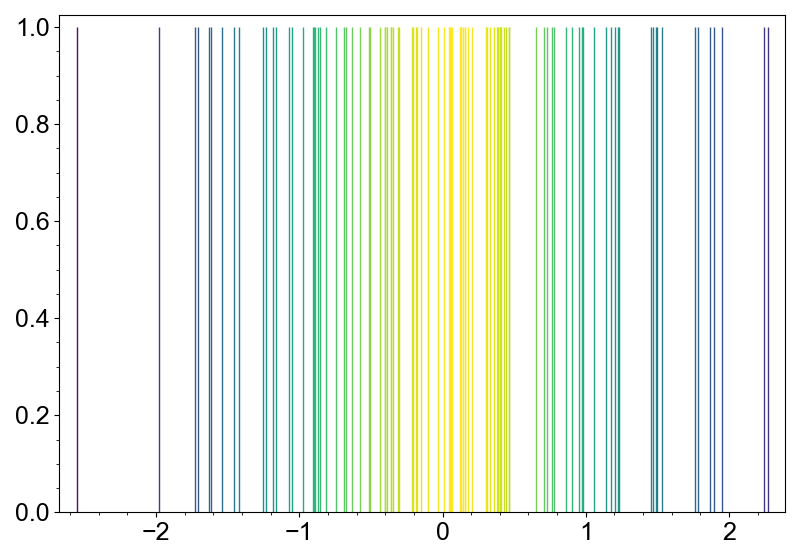
If you want to properly visualize the distribution only with the rug plot, you can use
the color or length of the rug lines to represent the density of the data points. Rug
layer has method color_by_density and scale_by_density to achieve this.
import numpy as np
from whitecanvas import new_canvas

np.random.seed(0)
data = np.random.normal(size=100)  # sample data

canvas = new_canvas("matplotlib")
canvas.add_rug(data).color_by_density(cmap="viridis")
canvas.show()
import numpy as np
from whitecanvas import new_canvas

np.random.seed(0)
data = np.random.normal(size=100)  # sample data

canvas = new_canvas("matplotlib")
canvas.add_rug(data).scale_by_density()
canvas.show()