Inset and Secondary Axis
Adding inset plot and/or secondary axis to the main plot are useful ways to display
different types of data in the same context. whitecanvas provides a very simple
way to add these types of plot elements.
Currently, this feature is implemented as follows:
| Feature | matplotlib |
plotly |
bokeh |
pyqtgraph |
vispy |
|---|---|---|---|---|---|
| Inset | ✓ | ✗ | ✗ | ✓ | ✗ |
| Secondary X | ✓ | ✗ | ✓ | ✓ | ✗ |
| Secondary Y | ✓ | ✓ | ✓ | ✓ | ✗ |
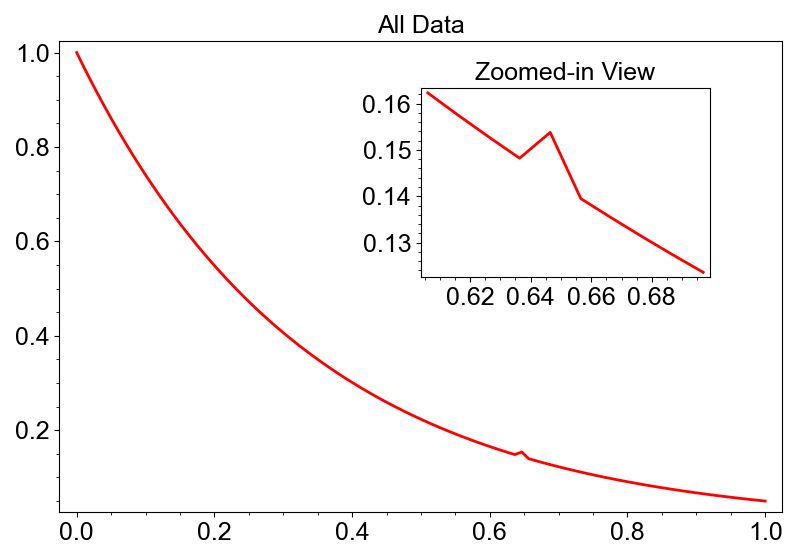
Inset Plot
Inset plot is a smaller plot that is embedded within the main plot. install_inset
method installs an inset plot to the main plot. A new canvas pointing at the inset
plot is returned.
import numpy as np
from whitecanvas import new_canvas

canvas = new_canvas("matplotlib")
inset = canvas.install_inset(left=0.5, right=0.9, bottom=0.5, top=0.9)

# data with small bump
x = np.linspace(0, 1, 100)
y = np.exp(-x * 3)
y[64] += 0.01

canvas.add_line(x, y, color="red")
canvas.title.text = "All Data"

inset.add_line(x[60:70], y[60:70], color="red")
inset.title.text = "Zoomed-in View"

canvas.show()
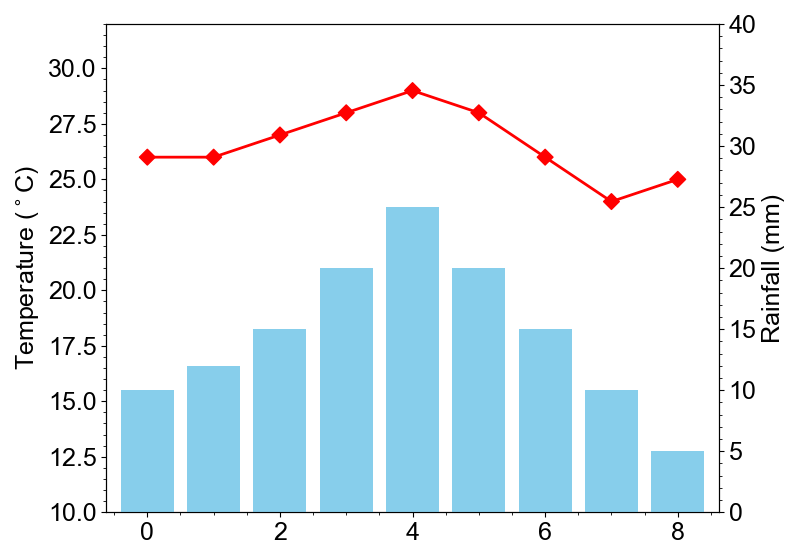
Secondary Axis
Secondary axis is another axis that is added to the main plot. install_second_x and
install_second_y methods install secondary x/y-axis, respectively.
import numpy as np
from whitecanvas import new_canvas

canvas = new_canvas("matplotlib")
other = canvas.install_second_y()

temperature = [26, 26, 27, 28, 29, 28, 26, 24, 25]
rainfall = [10, 12, 15, 20, 25, 20, 15, 10, 5]

canvas.add_line(temperature, color="red").with_markers(symbol="D")
canvas.y.lim = (10, 32)
canvas.y.label.text = "Temperature ($^\circ$C)"

other.add_bars(rainfall, color="skyblue")
other.y.lim = (0, 40)
other.y.label.text = "Rainfall (mm)"

canvas.show()