Lines
There are several layers that is composed of only lines.
Line... a simple line.LineStep... a line for the step plotInfLine... a straight line that extends to infinityInfCurve... a curve that extends to infinityErrorbar... lines representing error barsRug... lines representing rug plots
These layers have following properties in common.
color... color of the lines. Any color-like object is accepted.width... width of the lines. Should be a non-negative number.style... style of the lines. Should be one of"-",":","-.","--".
Note
style is not supported in some backends.
These properties can be configured in function calls, via properties or the update
method.
import numpy as np
from whitecanvas import new_canvas

canvas = new_canvas("matplotlib")

# function call
layer = canvas.add_line([0, 2, 1, 3, 4, 2, -1], color="black", width=2, style=":")

# properties
layer.color = "#FF36D9"
layer.width = 2.5
layer.style = "-"

# update method
layer.update(color=[0.0, 1.0, 0.0, 1.0], width=1, style="--")
canvas.show()

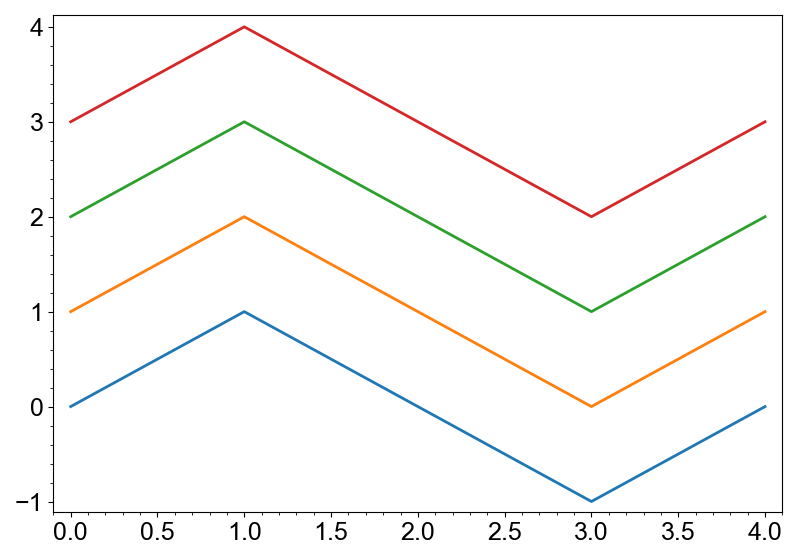
Line
Line is a simple line defined by two arrays of x and y coordinates. It is usually
created by the add_line method. This method
accepts several ways to define the line coordinates.
import numpy as np
from whitecanvas import new_canvas

canvas = new_canvas("matplotlib")

canvas.add_line([0, 1, 0, -1, 0])  # only y values
canvas.add_line([0, 1, 2, 3, 4], [1, 2, 1, 0, 1])  # x and y values
canvas.add_line(np.arange(5), np.array([2, 3, 2, 1, 2]))  # numpy arrays
canvas.add_line(np.array([[0, 3], [1, 4], [2, 3], [3, 2], [4, 3]]))  # (N, 2) array
canvas.show()
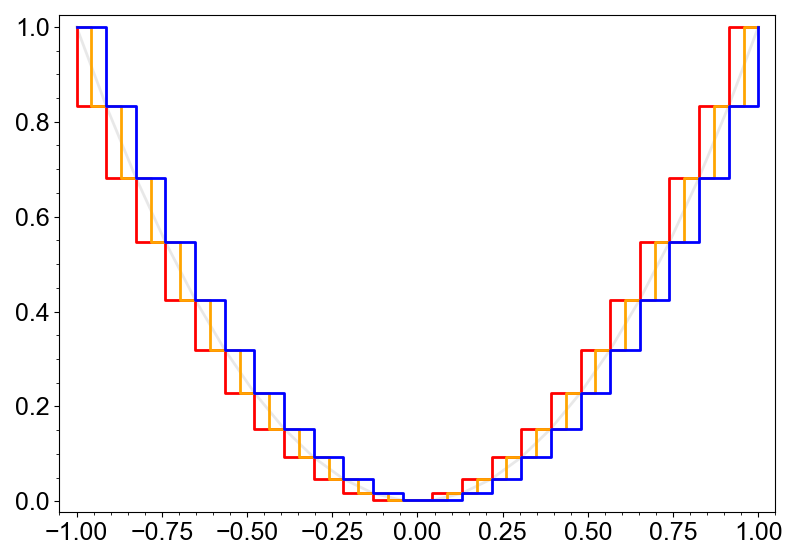
LineStep
LineStep is a line-type layer for the step plot. It is usually created by the
add_step method.
import numpy as np
from whitecanvas import new_canvas

canvas = new_canvas("matplotlib")

x = np.linspace(-1, 1, 24)
y = x ** 2
canvas.add_line(x, y, color="lightgray", alpha=0.5)
canvas.add_step(x, y, color="red", where="pre")
canvas.add_step(x, y, color="orange", where="mid")
canvas.add_step(x, y, color="blue", where="post")
canvas.show()
InfLine
InfLine is a straight line that extends to infinity. Practically, it is achieved by
connecting a callback that updates the line coordinates when the canvas view range is
updated.
InfLine is usually created by the add_infline method, or in the specific cases, add_vline and add_hline for vertical and horizontal lines, respectively.
import numpy as np
from whitecanvas import new_canvas

canvas = new_canvas("matplotlib")
canvas.add_infline((0, 1), 45, color="black")  # y = x + 1
canvas.add_vline(2, color="red")  # x = 2
canvas.add_hline(-1, color="blue")  # y = -1
canvas.x.lim = (-3, 3)
canvas.y.lim = (-3, 3)
canvas.show()

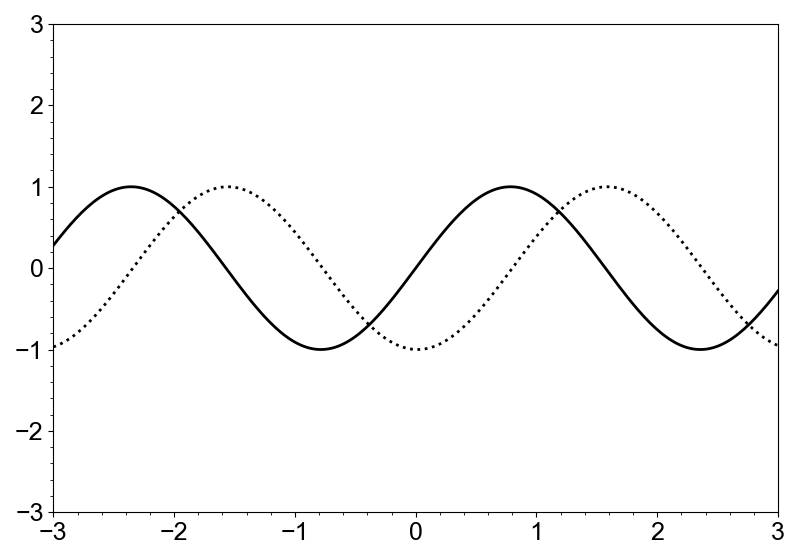
InfCurve
InfCurve is a curve that extends to infinity, defined by an arbitrary model function.
Practically, it is achieved by connecting a callback that resamples the curve when the
canvas view range is updated.
InfCurve is usually created by the [add_infcurve][whitecanvas.canvas.CanvasBase.
add_infcurve] method. The input model function must be defined as model(x, ...) where
x is ndarray of the x-coordinates and the rest of the arguments are the parameters
of the model. The parameters can be set by the update_params method of the returned
layer.
import numpy as np
from whitecanvas import new_canvas

def model(x, freq, phase):
    return np.sin(x * freq - phase)

canvas = new_canvas("matplotlib")
canvas.add_infcurve(model, color="black").update_params(freq=2, phase=0)
canvas.add_infcurve(model, color="black", style=":").update_params(freq=2, phase=1.6)
canvas.x.lim = (-3, 3)
canvas.y.lim = (-3, 3)
canvas.show()
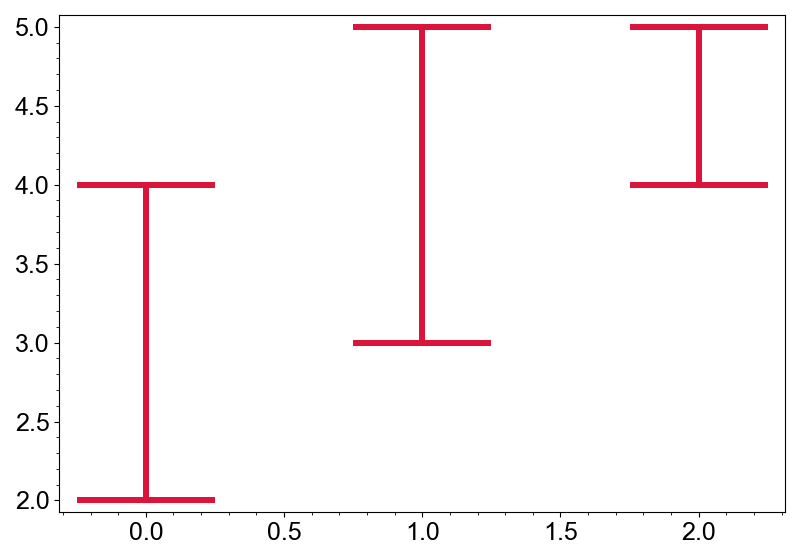
Errorbars
Errorbars is a layer that represents error bars with caps. It can be created by the
add_errorbars method, but if you intend
to add error bars to an existing layer with x/y data, try using the with_xerr and
with_yerr methods of the layer to group layers.
import numpy as np
from whitecanvas import new_canvas

canvas = new_canvas("matplotlib")
x = [0, 1, 2]
ylow = [2, 3, 4]
yhigh = [4, 5, 5]
canvas.add_errorbars(x, ylow, yhigh, capsize=0.5, width=3, color="crimson")
canvas.show()