Categorical Plot
Existing Python plotting libraries such as seaborn and plotly have an excellent
support for high-level categorical plotting methods that use DataFrame objects as input.
In whitecanvas, similar functions are provided, but these methods do not depend on
any external plotting libraries or DataFrames, and are more flexible in some cases.
The Categorical Plotters
Methods starting with "cat" return categorical plotters. Methods include:
cat... plotter for numerical data in x/y-axis categorized by such as color → Numerical × Numerical Data.cat_x... plotter for categorical data in x-axis → Categorical × Numerical Data.cat_y... plotter for categorical data in y-axis → Categorical × Numerical Data.cat_xy... plotter for categorical data in both x- and y-axis → Categorical × Categorical Data.
These methods need a tabular data and the names of the columns that will be used as the x and y values. Currently, following objects are allowed as the tabular data input:
dictof array-like objectspandas.DataFramepolars.DataFrame
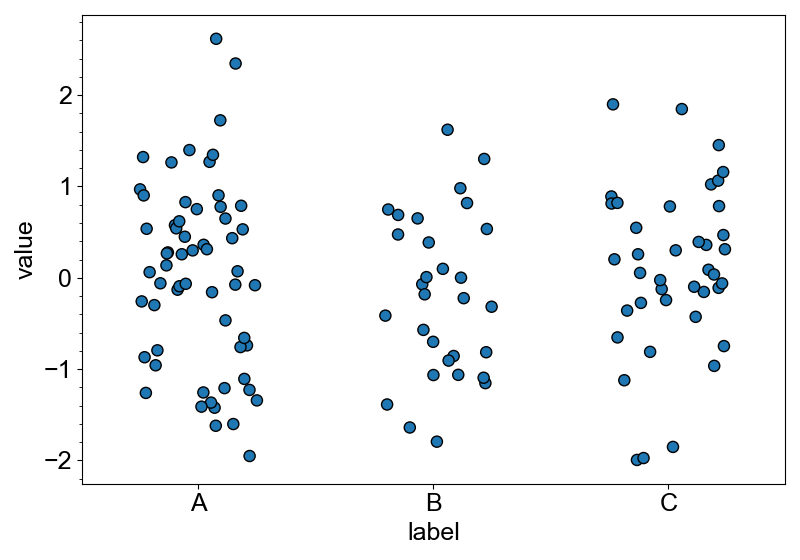
Following example shows how to make a strip plot.
import numpy as np
from whitecanvas import new_canvas

canvas = new_canvas("matplotlib")
rng = np.random.default_rng(12345)

# sample data
df = {
    "label": ["A"] * 60 + ["B"] * 30 + ["C"] * 40,
    "value": rng.normal(size=130),
}

canvas.cat_x(df, x="label", y="value").add_stripplot().with_edge(color="black")
canvas.show()