Stacking Layers
If a quantity can be cumulatively added, stacking is a great way to visualize the total amount of each data point. In this section, we will use the following data.
df = {
    "day": [0, 1, 2, 3, 0, 1, 2, 3, 0, 1, 2, 3],
    "value": [1, 5, 10, 20, 2, 6, 8, 15, 3, 6, 9, 12],
    "person": ["A"] * 4 + ["B"] * 4 + ["C"] * 4,
}
There are only limited number of plot types that can be stacked. Currently, area plot
and bar plot are supported. Methods to add these plots are in the "stacked categorical
plotter" object that can be created by the stack method of the categorical plotters.
from whitecanvas import new_canvas

canvas = new_canvas("matplotlib")
(
    canvas
    .cat_x(df, x="day", y="value")
    .stack(by="person")
    .add_area()
)
canvas
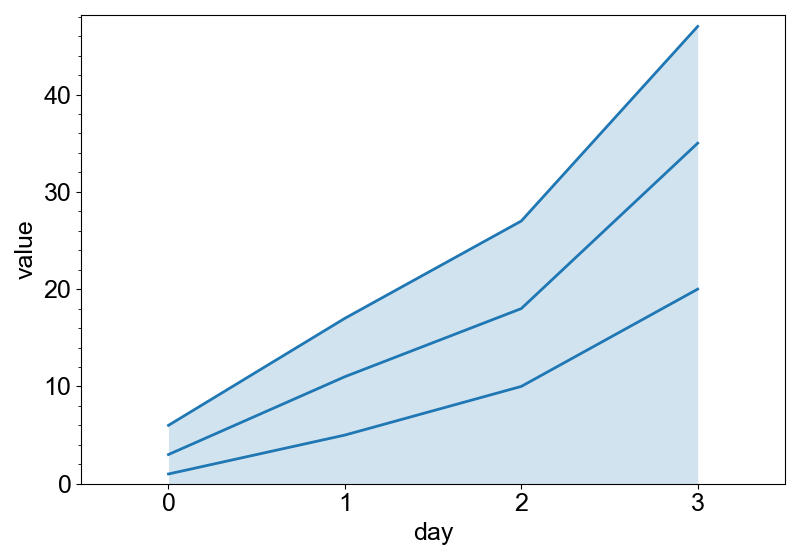
Here, the column "person" is used to stack the area plot, which means that the input data is split by the values in the "person" column, and the area plot is drawn for each category. These plots are stacked on top of each other.
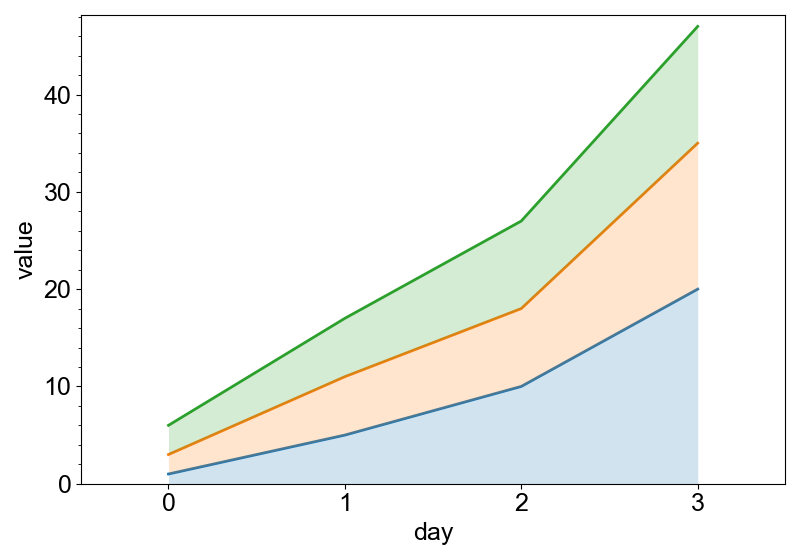
Each stack is usually drawn with a different color. You can give the same column name
as the color argument to the add_area method.
from whitecanvas import new_canvas

canvas = new_canvas("matplotlib")
(
    canvas
    .cat_x(df, x="day", y="value")
    .stack(by="person")
    .add_area(color="person")
)
canvas
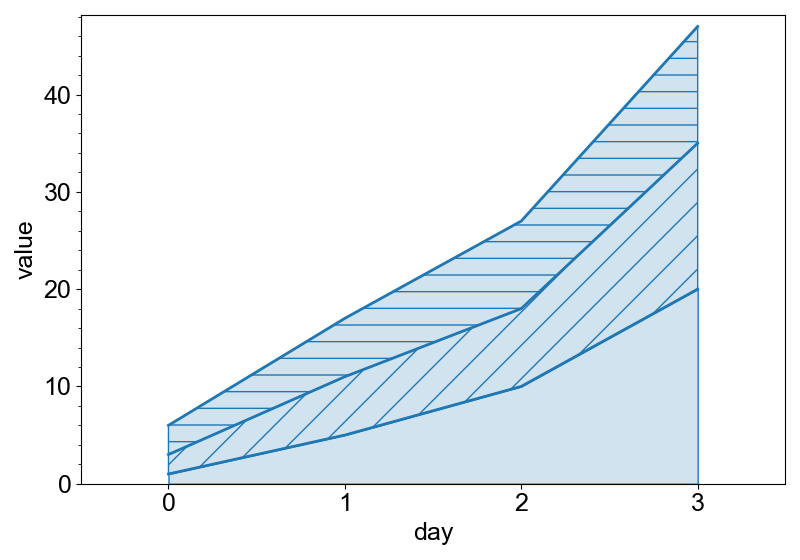
or, of course, drawn with different hatch patterns.
from whitecanvas import new_canvas

canvas = new_canvas("matplotlib")
(
    canvas
    .cat_x(df, x="day", y="value")
    .stack(by="person")
    .add_area(hatch="person")
)
canvas
The "person" column is given to both the stack and the add_area method. In these
cases, the argument of stack can be omitted.
from whitecanvas import new_canvas

canvas = new_canvas("matplotlib")
(
    canvas
    .cat_x(df, x="day", y="value")
    .stack()
    .add_area(color="person")
)
canvas
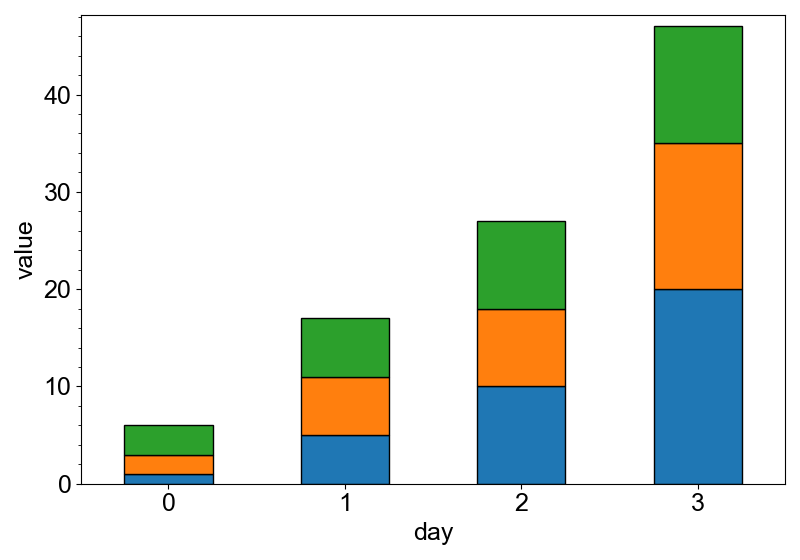
Another way to show the data is to use bar plots.
from whitecanvas import new_canvas

canvas = new_canvas("matplotlib")
(
    canvas
    .cat_x(df, x="day", y="value")
    .stack()
    .add_bars(color="person", extent=0.5)
)
canvas