Joint Plot
A joint plot is a plot that combines a main plot and two marginal plots. The main plot is usually a scatter plot, and the marginal plots are layers of histograms, KDE or rug plot.
whitecanvas provides a canvas grid class that is specifically designed for creating joint plots. It can be constructed using the new_jointgrid function.
from whitecanvas import new_jointgrid

grid = new_jointgrid(backend="matplotlib")
grid.show()
The layout of the joint grid can be customized using the loc argument. It indicates
the indices of the main canvas. The default value is (1, 0).
from whitecanvas import new_jointgrid

grid = new_jointgrid(backend="matplotlib", loc=(0, 0))
grid.show()
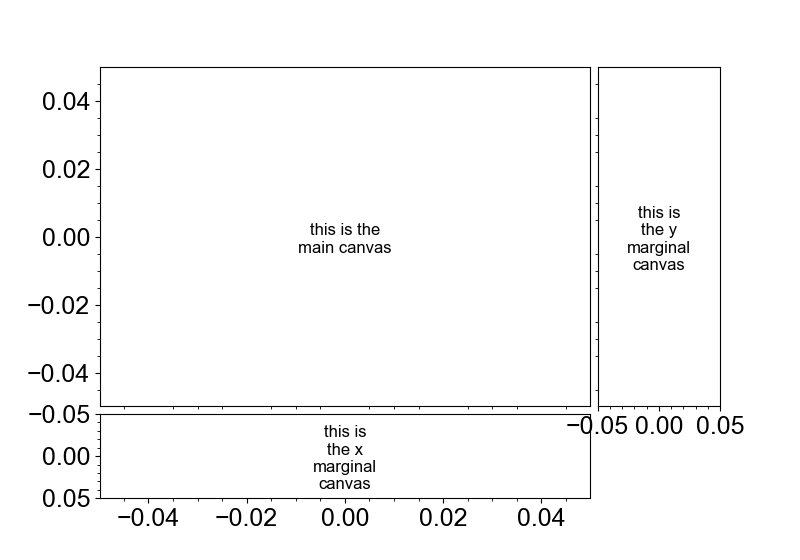
A good thing is that three canvases can be accessed using main_canvas, x_canvas and
y_canvas no matter what the layout is.
grid.main_canvas.add_text(0, 0, "this is the\nmain canvas", anchor="center")
grid.x_canvas.add_text(0, 0, "this is\nthe x\nmarginal\ncanvas", anchor="center")
grid.y_canvas.add_text(0, 0, "this is\nthe y\nmarginal\ncanvas", anchor="center")
Plotting Data on the Joint Grid
Joint grid provides methods to plot the 2D distribution on the main canvas and the marginal distributions on the marginal canvases.
import numpy as np
from whitecanvas import new_jointgrid

# sample data
np.random.seed(123456)
data = np.concatenate([
    np.random.normal(loc=(0, 0), scale=(1, 1), size=(30, 2)),
    np.random.normal(loc=(8, 7), scale=(1, 1), size=(60, 2)),
    np.random.normal(loc=(6, 1), scale=(1, 1), size=(40, 2)),
], axis=0)

grid = new_jointgrid(backend="matplotlib")
grid.add_markers(data[:, 0], data[:, 1])
grid.show()
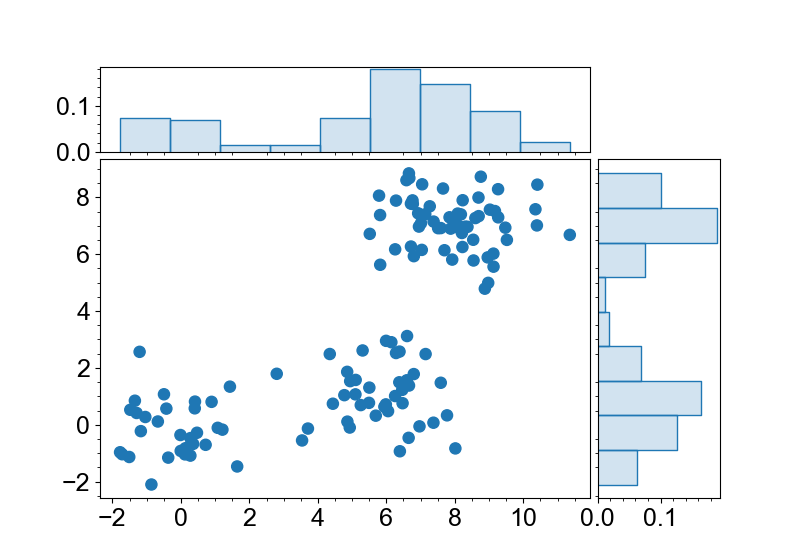
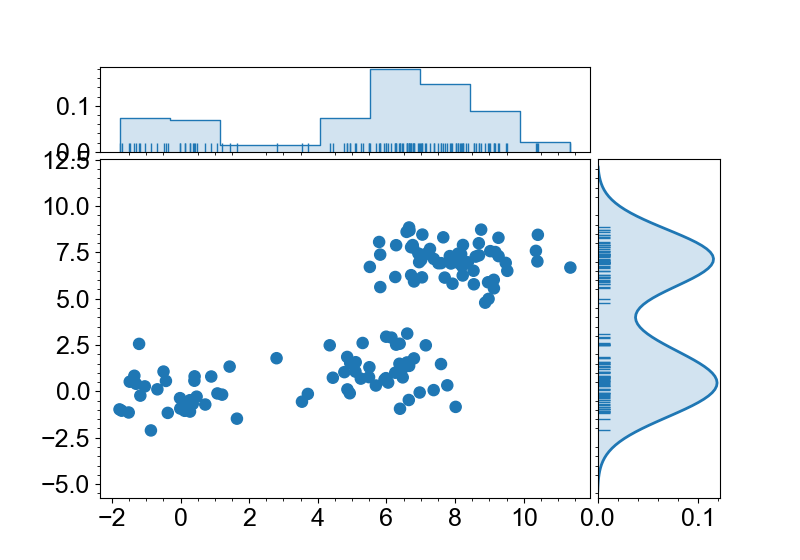
Joint grid uses histograms to visualize the marginal distributions by default. You can change the type of the marginal plots using with_* methods on construction.
import numpy as np
from whitecanvas import new_jointgrid

# sample data
np.random.seed(123456)
data = np.concatenate([
    np.random.normal(loc=(0, 0), scale=(1, 1), size=(30, 2)),
    np.random.normal(loc=(8, 7), scale=(1, 1), size=(60, 2)),
    np.random.normal(loc=(6, 1), scale=(1, 1), size=(40, 2)),
], axis=0)

# create a joint grid with customized marginal plots
grid = (
    new_jointgrid(backend="matplotlib")
    .with_hist_x(shape="step")  # show histogram as the x-marginal distribution
    .with_kde_y(width=2)  # show kde as the y-marginal distribution
    .with_rug(width=1)  # show rug plot for both marginal distributions
)

grid.add_markers(data[:, 0], data[:, 1])
grid.show()
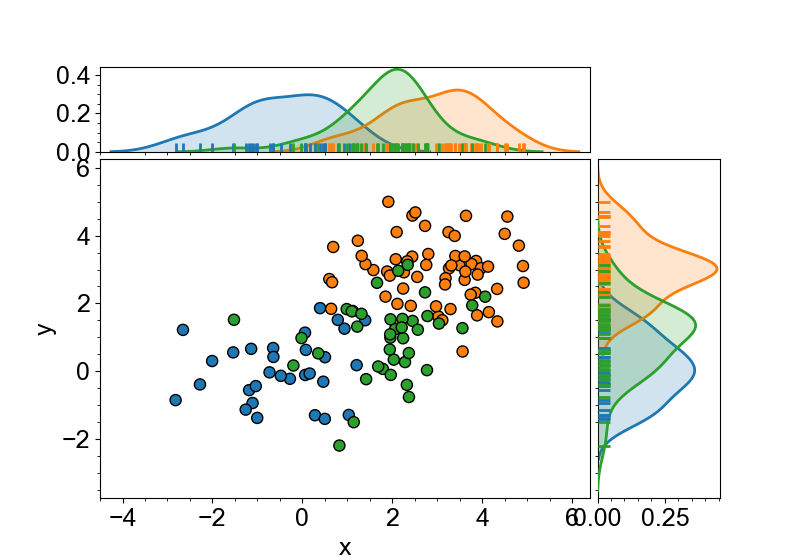
Categorical Plots on Joint Grid
whitecanvas has a flexible API for creating categorical plots. With the similar API, you can create a joint grid similarly. Here, we use the same
data as here.
from whitecanvas import new_canvas

# sample data
data = np.concatenate([
    np.random.normal(loc=(0, 0), scale=(1, 1), size=(30, 2)),
    np.random.normal(loc=(3, 3), scale=(1, 1), size=(60, 2)),
    np.random.normal(loc=(2, 1), scale=(1, 1), size=(40, 2)),
], axis=0)
df = {
    "x": data[:, 0],
    "y": data[:, 1],
    "label": np.repeat(["A", "B", "C"], [30, 60, 40]),
}

grid = (
    new_jointgrid(backend="matplotlib")
    .with_kde()
    .with_rug()
)
grid.cat(df, "x", "y").add_markers(color="label")
grid.show()