Quick Start
Create a canvas
The new_canvas function creates a new canvas, in which you can add many graphical
elements. Created canvas can be shown by calling show.
from whitecanvas import new_canvas

# create a canvas
canvas = new_canvas()

# show the canvas
canvas.show()
As whitecanvas is backend independent, you can specify a plotting backend when
creating the canvas.
canvas = new_canvas(backend="matplotlib") # matplotlib backend
Currently supported backends are:
For each backend, they also have their own application backend. For example,
matplotlib has Qt, Tk and many other backends, and pyqtgraph has Qt and
notebook backend. You can add a suffix with separator ":" to the backend name to
specify which application backend to use.
canvas = new_canvas(backend="matplotlib:qt")  # matplotlib with Qt backend
canvas = new_canvas(backend="pyqtgraph:notebook")  # pyqtgraph with notebook backend
Let's plot!
Here is a simple example to add a line and a scatter plot to the canvas.
from whitecanvas import new_canvas

canvas = new_canvas(backend="matplotlib")
canvas.add_line([0, 1, 2, 3], [0, 1, 1, 0])
canvas.add_markers([0, 1, 2, 3], [1, 2, 0, 1])
canvas.show()

You can also add more options.
from whitecanvas import new_canvas

canvas = new_canvas(backend="matplotlib")
canvas.add_line([0, 1, 2, 3], [0, 1, 1, 0], color="red", width=2, style=":")
canvas.add_markers([0, 1, 2, 3], [1, 2, 0, 1], symbol="s", size=20, color="blue")
canvas.show()

Methods always return a Layer object (with minor exceptions), which is also added to
the list-like layers attribute of the canvas.
from whitecanvas import new_canvas

canvas = new_canvas(backend="matplotlib")
line_layer = canvas.add_line([0, 1, 2, 3], [0, 1, 1, 0])
markers_layer = canvas.add_markers([0, 1, 2, 3], [1, 2, 0, 1])
canvas.layers[0] is line_layer  # True
canvas.layers[1] is markers_layer  # True
Color, size, style, etc. can also be configured via the layer properties.
line_layer.color = "red"
markers_layer.symbol = "s"
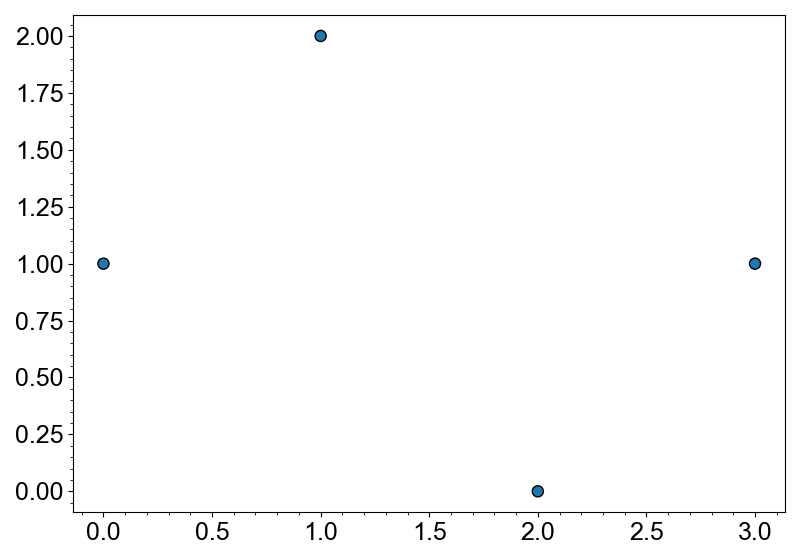
A major difference between whitecanvas and other plotting libraries is that all the
edge properties are set using with_edge method.
from whitecanvas import new_canvas

canvas = new_canvas(backend="matplotlib")
markers_layer = canvas.add_markers(
    [0, 1, 2, 3], [1, 2, 0, 1]
).with_edge(color="black", width=1)
canvas.show()
Wanna use DataFrames?
whitecanvas has a built-in support for DataFrame-like objects for categorical
plotting. See Categorical Plotting for more details.